BDSA's Rapid Retail Sales Tracking (Rapid RST) is an accelerated delivery cadence of Retail Sales Tracking (RST) data.
Table Of Contents
What Is Rapid Retail Sales Tracking?
Cadence of Updates Driving Rapid Retail Sales to be Dynamic
Rapid Retail Sales Tracking vs. Enhanced Retail Sales Tracking
Rapid Retail Sales Tracking Methodology
Rapid RST GreenEdge Tips & Callouts
Frequently Asked Questions
What Is Rapid Retail Sales Tracking?
BDSA's Rapid Retail Sales Tracking (Rapid RST) is an accelerated delivery cadence of Retail Sales Tracking (RST) data.
Rapid RST consists of weekly data delivered for Monday through Sunday two weeks prior, published each Thursday (a 10-day lag). The data is available to the brand level with attributes limited to Item Weight and Items Per Pack. Rapid RST will be available in all fully published RST markets ("fully" is defined as markets available at the brand/product level in Enhanced RST). Rapid RST is available with a more limited selection of dashboards than Enhanced RST.
Note that Rapid RST is a dynamic dataset. The dataset available through Rapid RST changes as BDSA receives and processes additional data from retail partners and updates total market sales when state data is known. Rapid RST datasets will be replaced by Enhanced RST, a thoroughly cleaned and authoritative dataset, as Enhanced RST is made available for a given time period. Because of that, the Rapid RST sales projections will flex slightly, week-to-week, with the dataset converging with monthly Enhanced RST publication.
For example, Rapid RST may show a market on track to hit $100MM of total sales for a given month with 50% of sales in Flower, 25% in Concentrates, and 25% in Ingestibles. Enhanced RST, which typically publishes about four weeks after Rapid RST, may show that actual sales were $102MM with 48% in Flower, 26% in Concentrates, and 26% in Ingestibles.
These variations occur as BDSA's Analytics team collects, cleans, codes, and normalizes data from thousands of data sources to build the Enhanced RST dataset. Rapid RST provides early insight into the direction of the market by total sales, categories, and brands.
Cadence of Updates Driving Rapid Retail Sales to be Dynamic
1. Ongoing: Data from retail partners received, cleaned, and processed by BDSA throughout the month.
2. Weeks 1 or 3 of each month (bi-weekly): Actual total market sales known from states are updated.
3. Week 4 of each month: BDSA Enhanced published for the prior month.
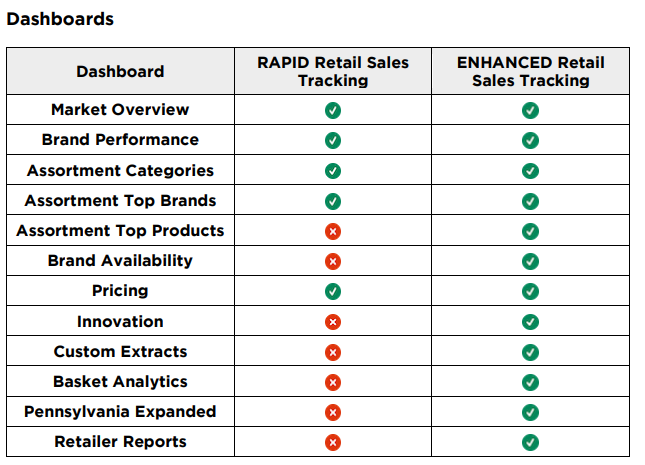
Rapid Retail Sales Tracking vs. Enhanced Retail Sales Tracking


Rapid Retail Sales Tracking Methodology
As with BDSA's Enhanced RST, Rapid RST builds off transactional store-level data from a representative panel of retailers. Approximately 95% of the data BDSA receives from data partners is ingested daily or weekly and feeds directly into Rapid RST. The rest of the data is received less frequently. For Rapid Retail Sales Tracking, BDSA extrapolates the expected sales for the remaining retailers to estimate the raw sales we anticipate. Once the monthly data is received, BDSA's Analytics team replaces the extrapolations with the actual sales received from these retailers.
An assessment of this model shows BDSA’s data extrapolation methodology to be within +/-5% of actual daily store sales.
BDSA has also adjusted the Enhanced RST methodology to align with weekly publishing, replacing the previously used monthly periods. Due to the accelerated delivery, there is more projection and forecasting in Rapid RST than Enhanced RST (i.e., Rapid RST is more subjective than Enhanced RST). The forecast model for total sales by market uses multiplicative exponential smoothing to forecast total sales for each channel in each market.
BDSA’s Rapid RST forecasting methodology benchmarked within +/-10% of BDSA’s Enhanced RST modeling over three months.
Rapid RST GreenEdge™ Tips & Callouts
Filtering by weeks
You will notice that the date format for weeks within widgets does not match the date format in the Date filter. Dates within widgets are represented in a yyyy-mm-dd format, representing the first Monday of that week. The Date filter is in a ww yyyy format, with ww representing the BDSA week number in that year. For example, when filtering to 07 2022, the widget will reflect data
for 2022-02-14 because that is the seventh week of 2022. A mapping of BDSA week numbers to calendar dates is available under the Resources menu item within GreenEdge for easy reference.
Attached filters
If the dimension you are filtering on is attached to a filter above it, meaning there is no purple divider between them, those filters are dependent on all attached filters above. Those filters will work as a group, meaning changing one will change the others in the group. For example, if you have the State and Level 3 filters set (e.g., California, Beverages), then you change the State
(e.g., shifting to Arizona). All category filters below will automatically reset, so you will need to edit the Level 3 filter (e.g., reselect Beverages).
Frequently Asked Questions
How is BDSA able to now supply Retail Sales Tracking on a faster cadence?
BDSA made improvements to increase the automation of our methodology, leveraging over five years of data cleaning and coding. These improvements include enhancing the stability and automation of our various POS connections, automating manual tasks, and building a robust product deduplication and matching system leveraging recent technology improvements. These advancements allow BDSA to process sales data in near real-time, and we are excited to pass on these benefits to our clients.
If the Rapid RST dataset is dynamic, what changes it and how often?
As more data becomes available to BDSA, Rapid RST projections will flex week-to-week as we factor in new data, driven by two primary data workstreams. First, the volume of data grows throughout the period, and that additional data drives updated projections. Second, BDSA's Data Management team is constantly cleaning and coding "new" data for new products, preventing duplicate products, removing anomalous transactions, and catching other errors in the data. Cannabis POS data is notoriously "dirty" and machine-driven technologies can only achieve certain levels of accuracy.
Throughout each period, Rapid RST will become more accurate and then be superseded by Enhanced RST data as it is available. The following factors contribute to the flux in Rapid Retail Sales Tracking weekly projections to varying degrees.
Application of State-Published Sales Data
As state-published sales data is made available, BSDA's Analytics team will update monthly total market sales. These updates will occur approximately twice per month (1st and 3rd weeks). Updates are dependent on state-published data availability.
BDSA’s Rapid RST forecasting methodology benchmarked within +/-10% of BDSA’s Enhanced RST modeling over three months.
“Slower” Data Feeds
As BDSA receives and ingests retail data sent by retailers monthly (about 5% of our panel), we will overwrite extrapolations with the actuals for each retail location. The impact of applying retail sales actuals to our underlying panel of sales will vary depending on the size and brand/category distribution of the retailer.
An assessment of this model shows BDSA’s data extrapolation methodology to be within +/-5% of actual daily store sales.
Coding, Cleaning, and Normalization
BDSA's Data Management team uses various tools to review POS data, identify new products and brands, de-duplicate product variants, normalize product attribute information, and add additional attributes. For example, the team reviews and adds minor cannabinoid information, verifies that cannabinoid percentages are correct, and adjusts categorization, among various other tasks. These steps create the Enhanced RST datasets that allow for deep-dive analysis, and they may drive minor changes within the Rapid RST dataset. For example, re-categorizing a product will shift category sales percentages, driving a minor change in a category ARP or brand share if the product in question has high sales. These changes are typically minor as market-leading products will already be coded and categorized correctly.
Weekly Calendar Reference

