Patient demographic data and shopper insights for PA
Table of Contents
Key Questions Answered
- Our marketing team is trying to understand who our brand's average consumer looks like. What is their demographic profile?
- Do different age groups gravitate toward different types of products?
- Is there a difference in brand popularity by gender?
- I want to know my target audience for a promotion. What is the demographic makeup of the brand I'm trying to promote?
Demographic Profile
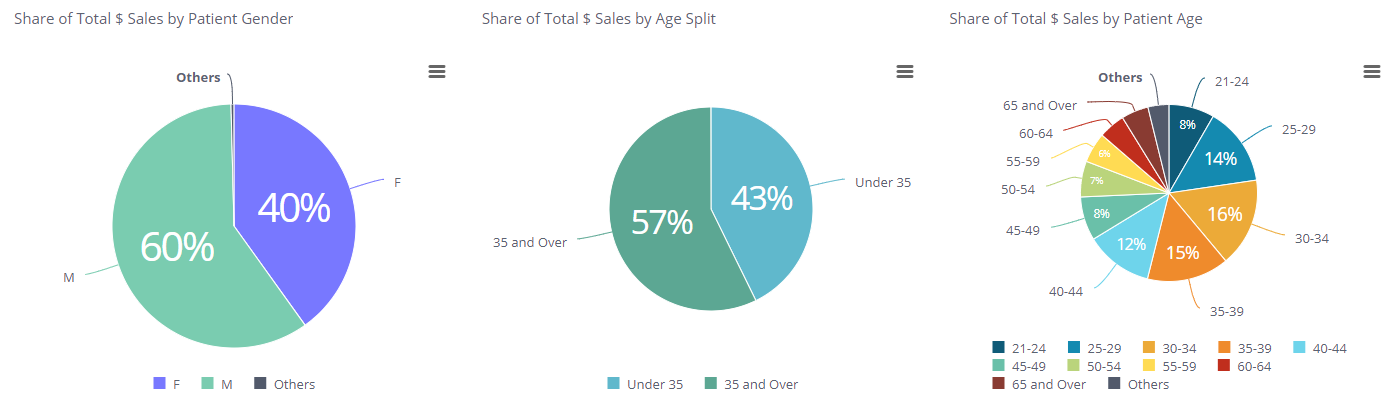
Share of sales among genders and different age groups. Drill into brand and categories to optimize marketing and strategy.
Category Mix
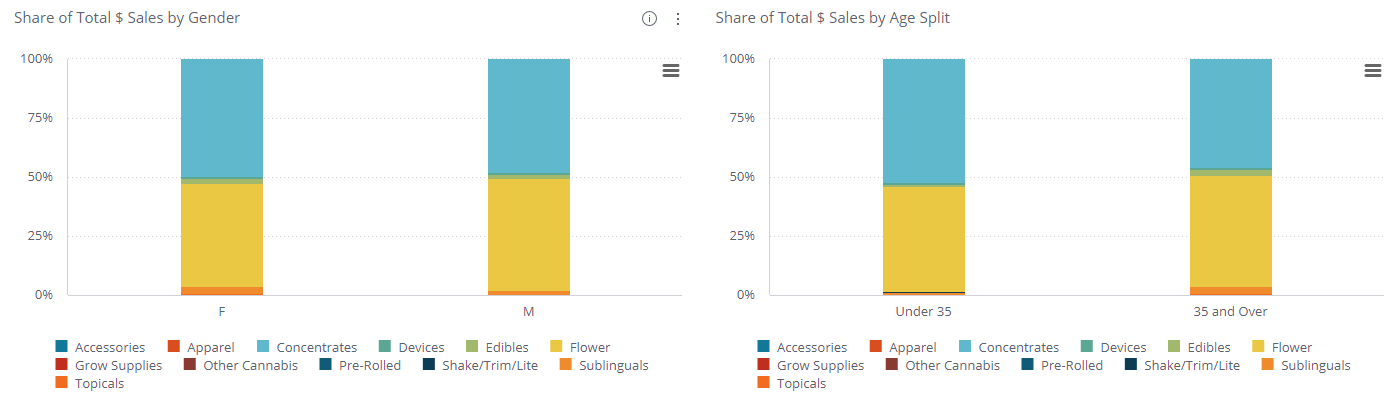
Adding a layer to the demographic data by including category allows users to gain insight on sales distribution among categories, broken out by demographic profiles.
Top Brands by Age and Gender
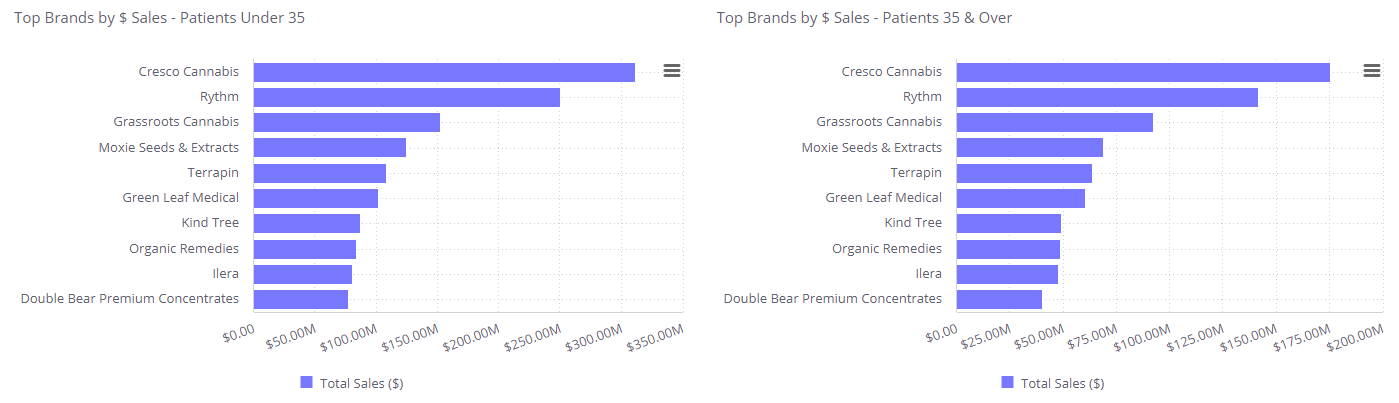
Compare top brands by age groups to understand brand loyalty.
- Sometimes top brands may be the same among age groups, but looking at the number of total dollar sales and using it to calculate market share of that age group can help indicate brand loyalty.
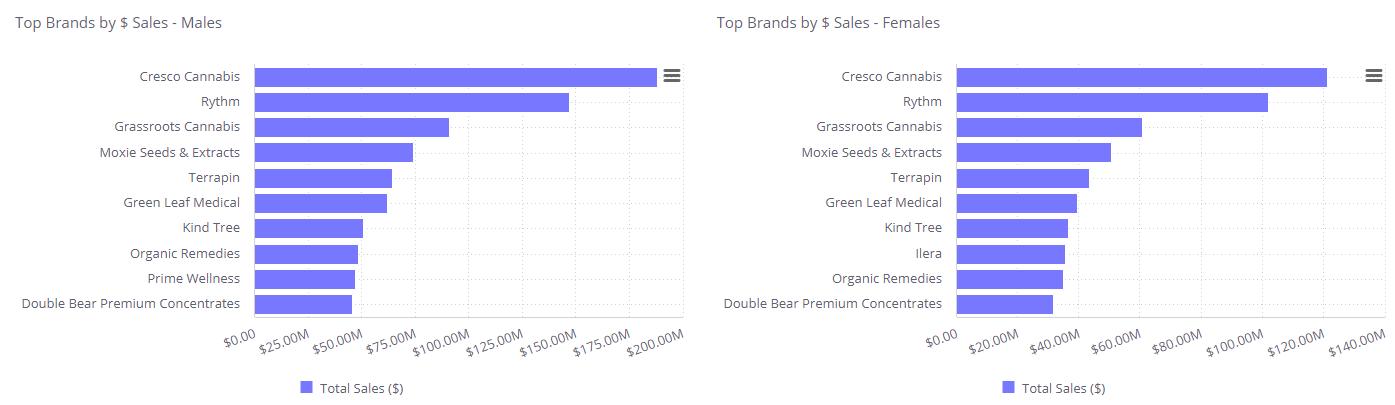
Compare top brands by gender to understand brand loyalty.
Shopper Insights
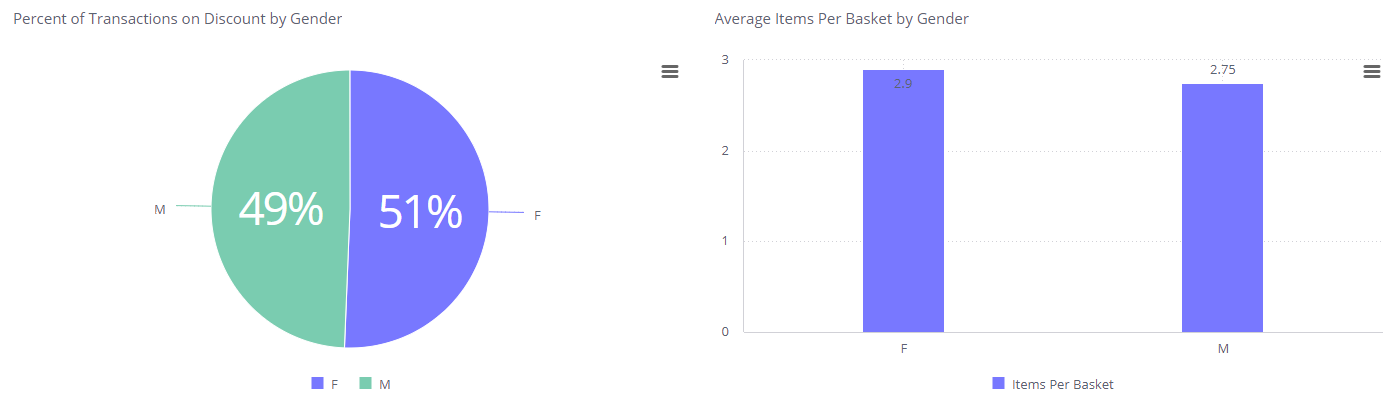
Breaking out purchase decisions by gender can help understand habits of patients. In the above example, I know women are purchasing slightly more and more likely to purchase at a discount. This can help inform marketing decisions and target audience for products and promotions.
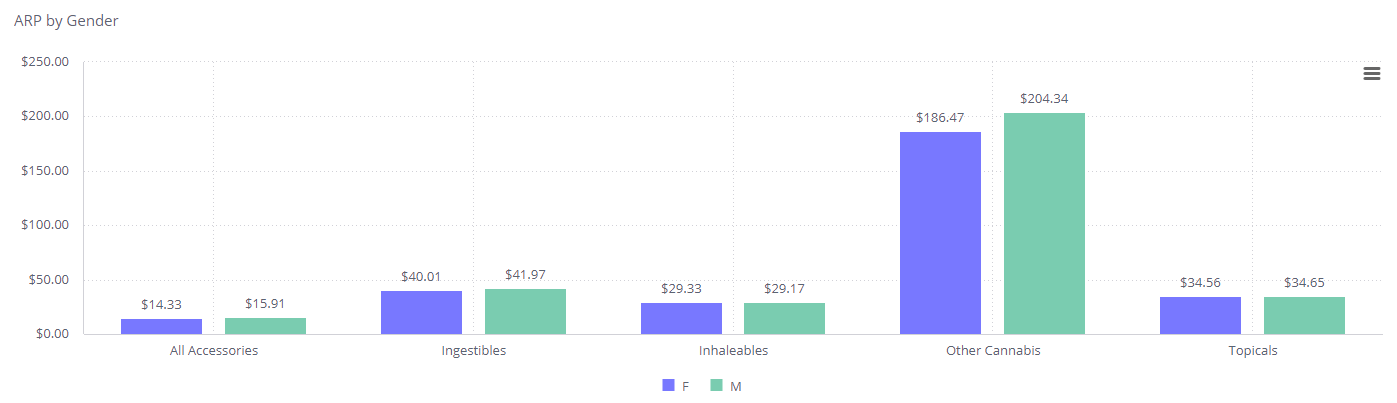
Breaking out ARP by category and gender furthers the story of purchase intent by adding average price paid by each gender. This adds to the story of what people are willing to pay on average, also adding to marketing and price strategy.