PA specific pricing dashboard to track average price (discounted and non-discounted), margin, and the relationship between price and units
Table of Contents
Pricing by Attributes - by ARP
Key Questions Answered
- What is the relationship between ARP and units sold?
- How deep is the average discount for my brand relative to the average price?
- I'm looking to run a category wide promotion. How deep is the average discount for that category?
- How many units are being sold at each price point?
- What is the share of items being sold at a discount vs at full price?
Snapshot
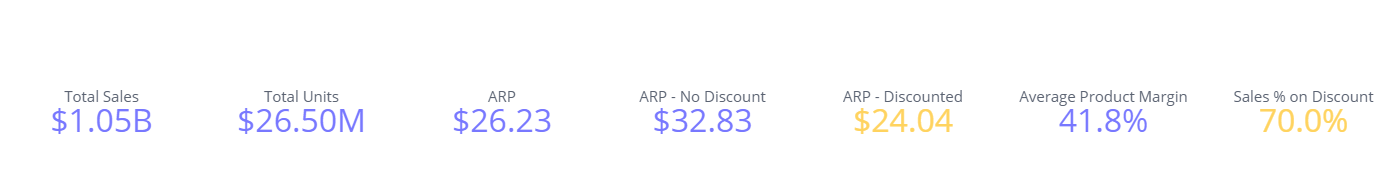
High level KPIs for pricing in PA. Utilize filters to get a glimpse at price, discounting, and margin for specific categories.
Price Trending

Size of category to use at a reference point when evaluating pricing dynamics.
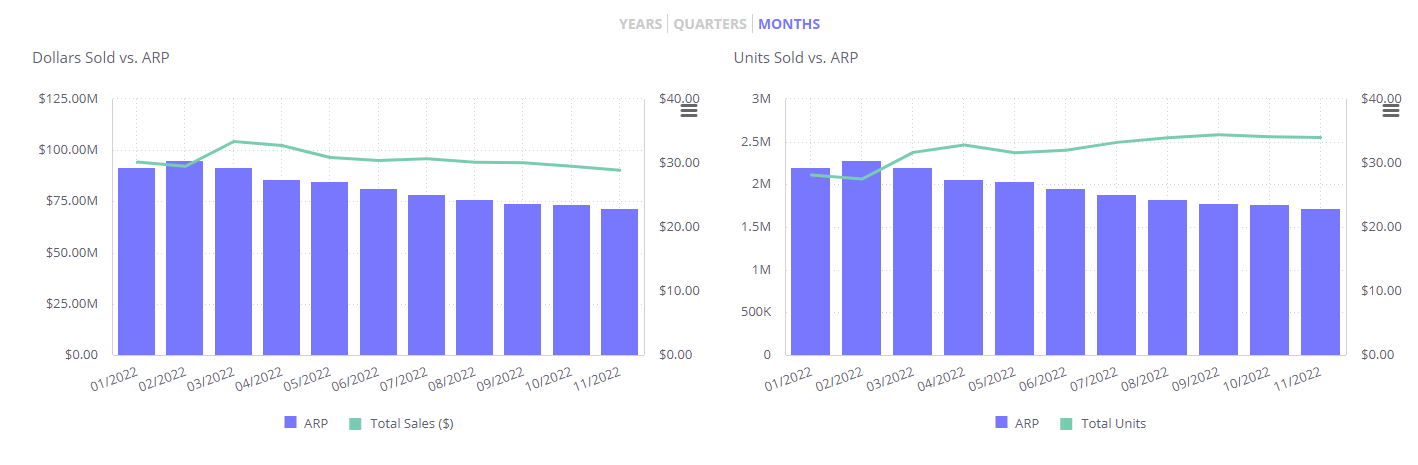
Evaluate the impact on dollar and unit sales based on price changes over a select period of time.
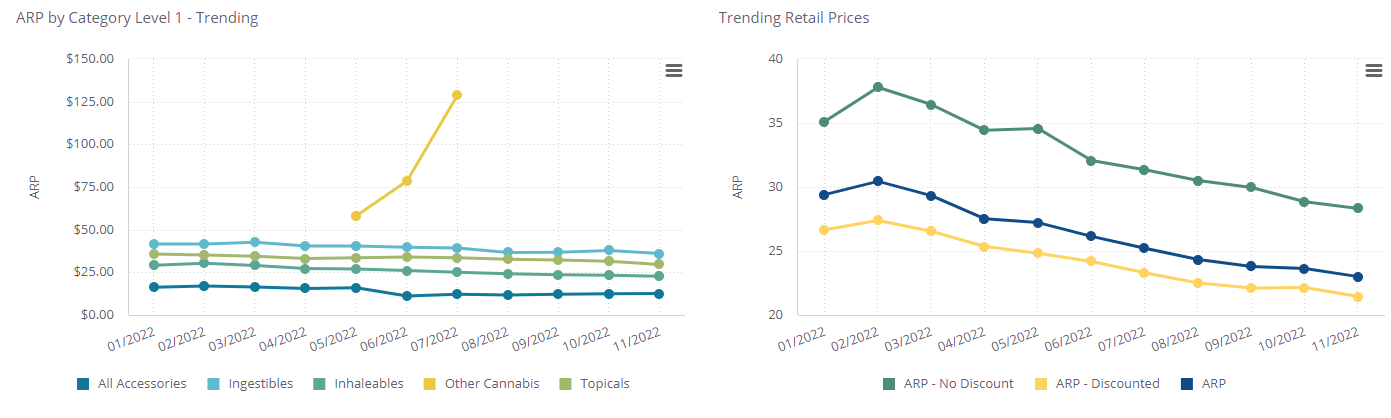
View category trends over a selected period of time to get a more granular view at category specific ARP changes. From there follow the trend of discounted, non-discounted, and average price over the same period of time.
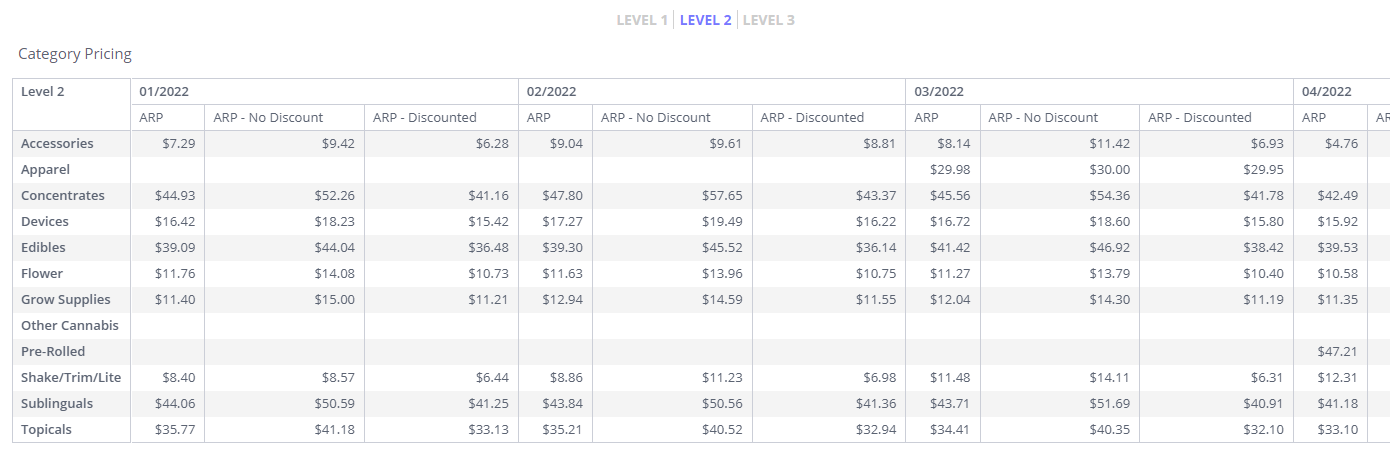
Use the tabular view to get all pricing types trending by each category. Use the tabber to specify which category level you'd like to see in an easily exportable format.
Pricing by THC Range
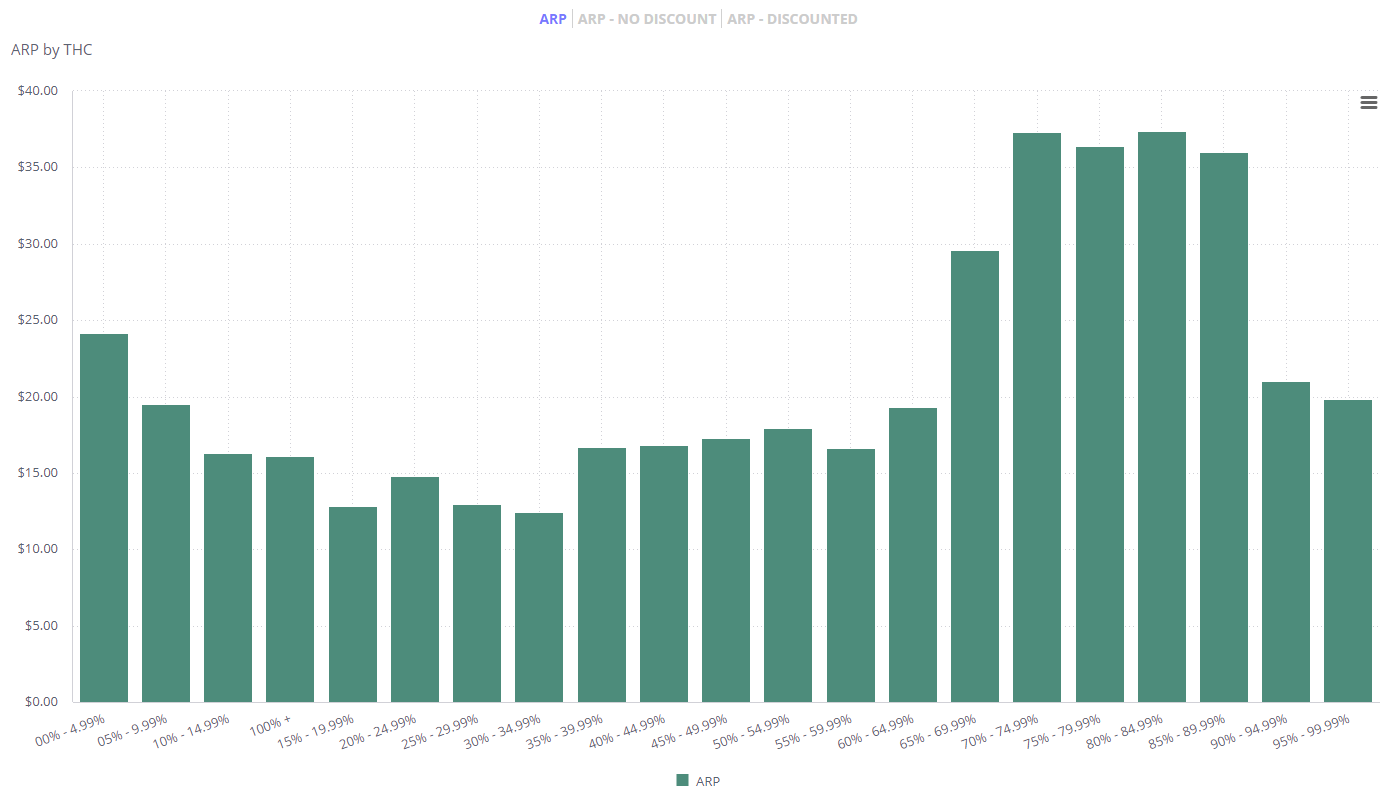
Compare ARP across different THC percentages.
Pricing by Attributes
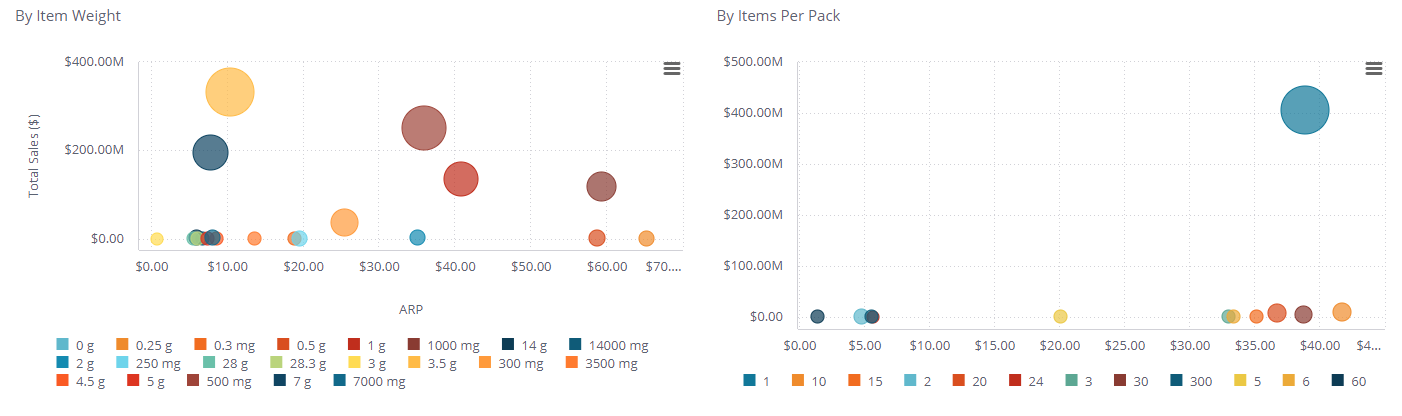
Break out pricing by common product attributes to understand more granularly how pricing is different based on size and weight.
We recommend using category filters on this section to only see sizes and pricing relevant to a category.
Price Increments
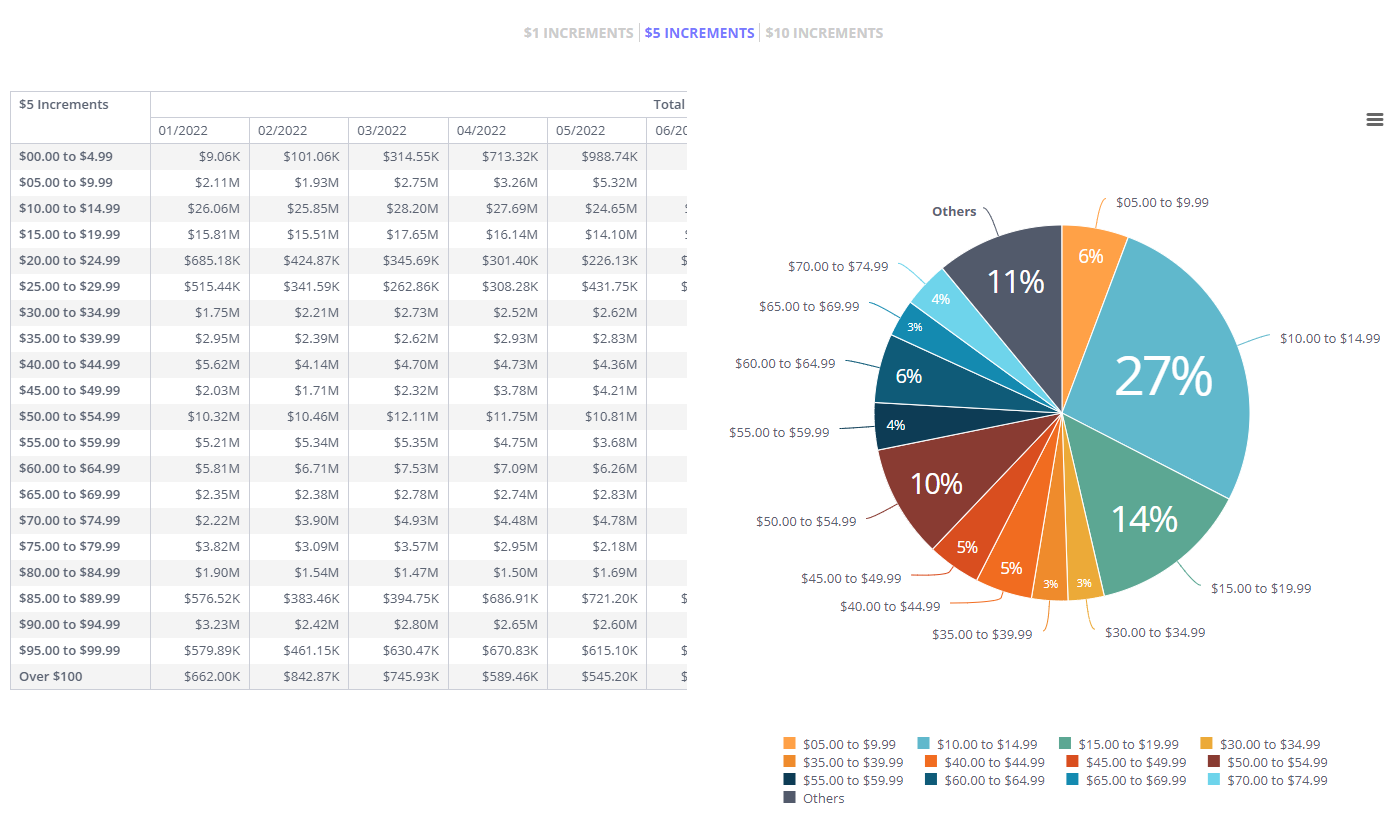
Share of the number of units sold in $1, $5, and $10 increments (based on EQ price bands) paired with total dollars sales in each as well.
Best used when filtered to a specific category to understand the concentration of prices and where your brand falls in that array.
Promotion Analysis - $ Sales
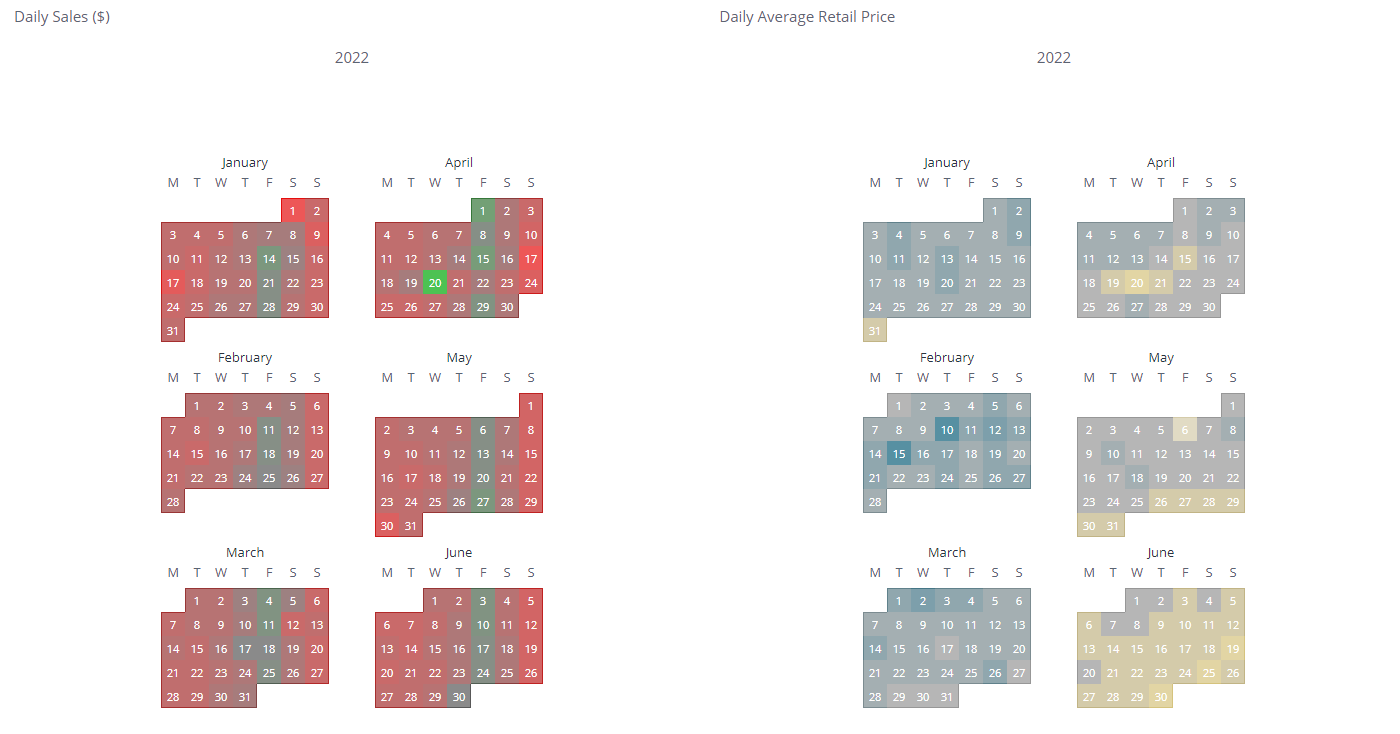
Evaluate day to day impact price has on dollar sales by aligning calendars to visualize the relationship between the two.
Daily Sales:
- Red - lower end of total sales.
- Green - higher end of total sales.
Daily ARP:
- Yellow - lower end of ARP.
- Blue - higher end of total ARP.
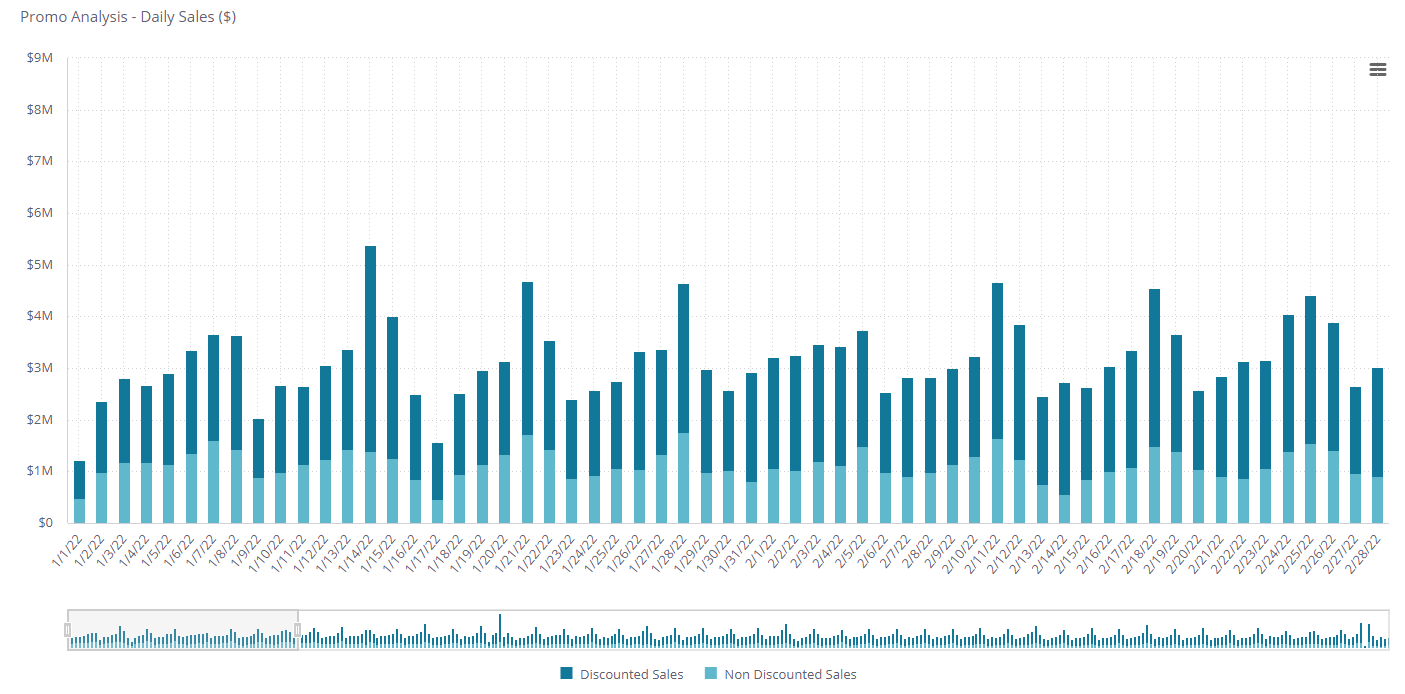
Follow the daily trend of the distribution of sales that were sold at a discount vs full price. Use overtime to see when discounts are most likely to happen and tailor your strategy around it. Can also drill into certain categories to understand if there are certain days where categories are more likely to be at a discount.
Fulfillment Method
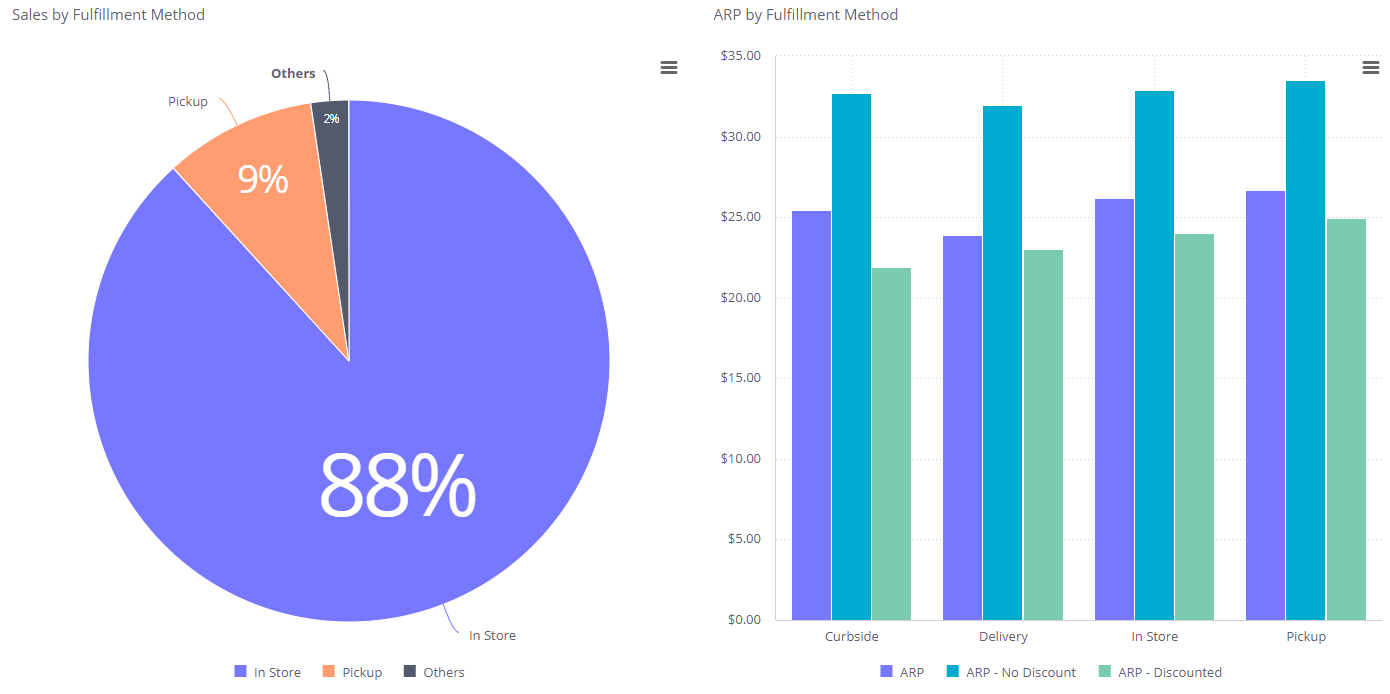
Use the sales breakdown by fulfillment type as a benchmark for ARP. Then use the ARP by Fulfillment method chart to track ARP types by different fulfillment methods.