Provides a deeper look at a brand’s in store performance vs competitors
Table Of Contents
Please note these dashboards are only available for Retail Data Sharing Partners who subscribe to Basket Analytics
Key Questions Answered
- What brands are bought most frequently in my store(s)?
- I'm doing an assortment evaluation and want to optimize the brands I'm selling in each category. Which brands are producing the largest basket size in each category?
- I like to set my owned brand prices at a higher discount than brands wholesaling into my store. What is my ARP compared to other brands?
- A wholesalers reached out asking if I want to restock their products. How has their brand performed against the average of all brands across my locations?
Overview
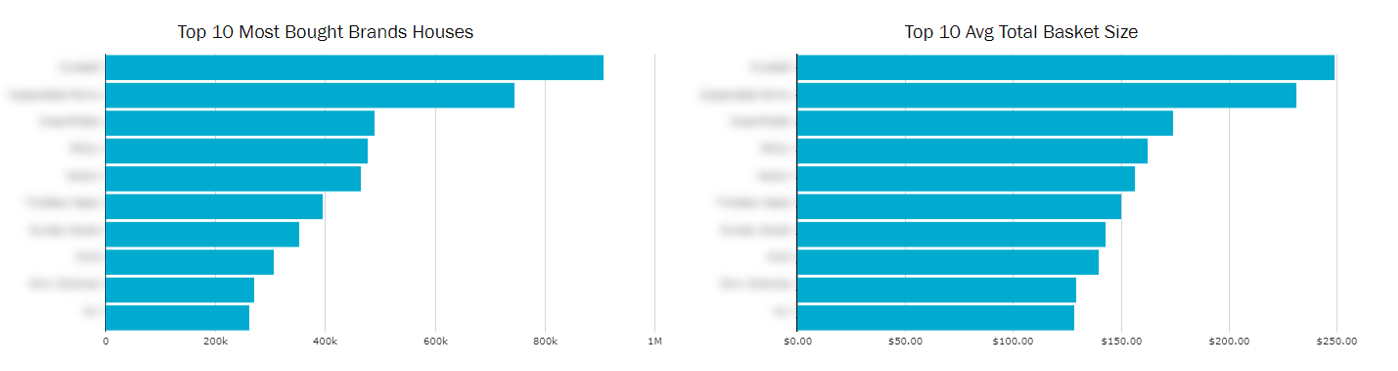
Use these widgets to track basket size and basket penetration across available time periods.
- Top 10 Most Bought Brands represents the top 10 brands in the most number of transactions.
- Top 10 Avg Basket Size represents the top 10 brands that, on average, are in baskets with the largest transaction subtotal.
Brand Evaluation
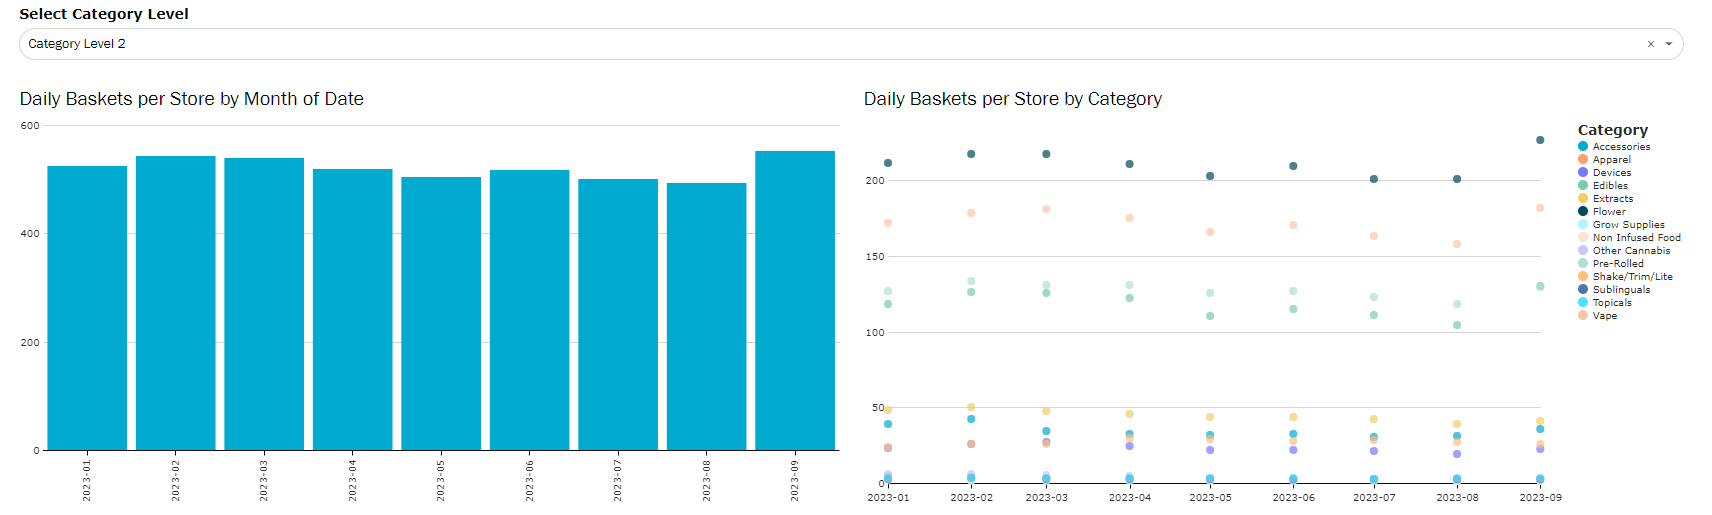
Use brand filter to track Daily Baskets per Store overtime in total, as well as by category for your brand.
- Compare the number of baskets your brand can be found in across an extended time period
- Track impact of brand launch, new product line, and category expansion by measuring impact to purchase frequency.

Use the brand filter to track brand penetration and basket size over time for your brand at all category levels using the category toggle above the visuals.
- Use these visuals to create brand strategy around which products are being bought the most vs increasing the overall purchase size.
- If a brand is not selected, basket penetration will be 100% and basket size will reflect the entire category.
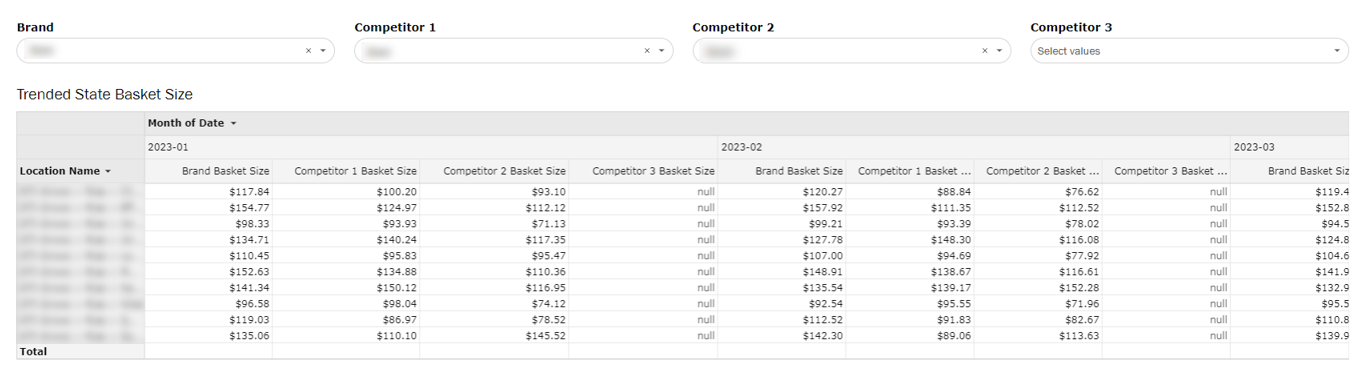
Use the brand filter to select your brand, then select up to 3 competitors to see how you compare to your competitors.
- Compare overall average basket size as well as breaking down which states your competitors are in (depending on subscription) and their performance.
- If a brand or competitor is not picked, it'll return "null".
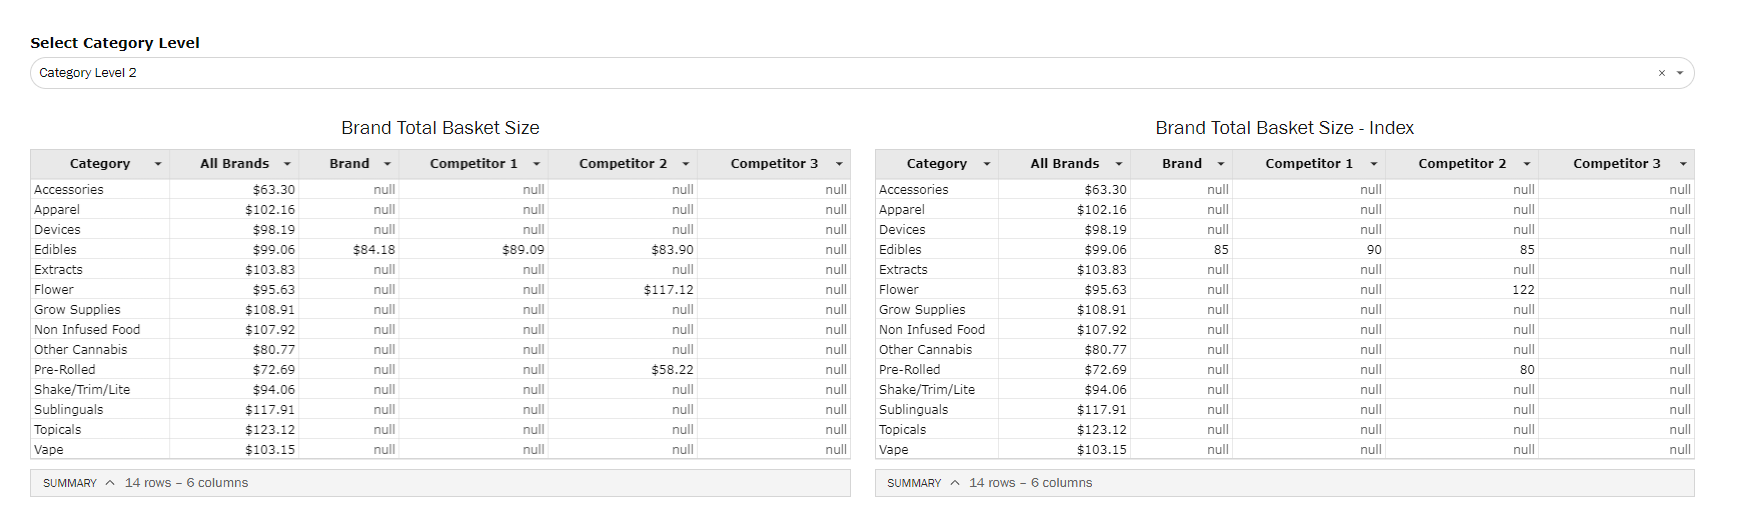
Use the Index vs Actual tab changer to see where your and your competitors' relative basket size and ARP compared to all brands, as well as what your actual basket size.
What is an index?
- An index represents the % above or below the metric you're comparing against.
- Ex: if the basket size index is 105 compared to all brands, then baskets with that brand in it are 5% larger than average. If your index is 95, then it’s 5% smaller. If your index is 100, it’s exactly the same as the average.
- Use indexing to inform directionally what % higher or lower you are than the average. Use actuals to complete the story by seeing the raw numbers
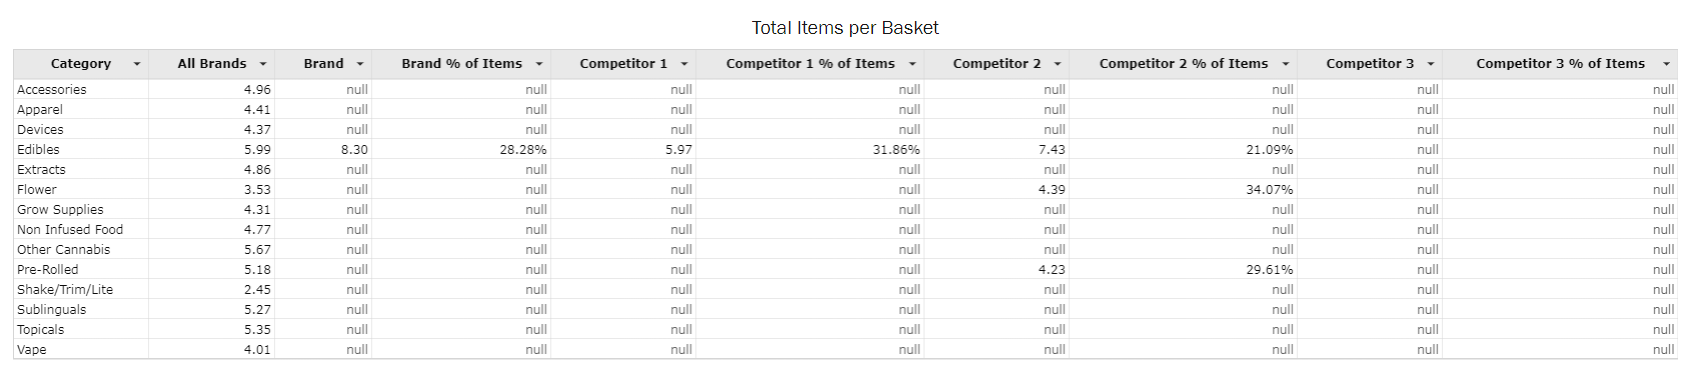
Total Items per Basket will reflect both the average total number of items in a basket containing the selected brand and category, as well as how many of those items belong to that brand.
- In the above example, baskets that contains the selected brand's edibles average about 8 items per basket across all categories. Of those 8 items, about 28% on average belong to that brand's edible items.
- This information can be utilized to understand what brand's are pushing a larger total basket and what brands account for the majority of items in a basket when purchased.
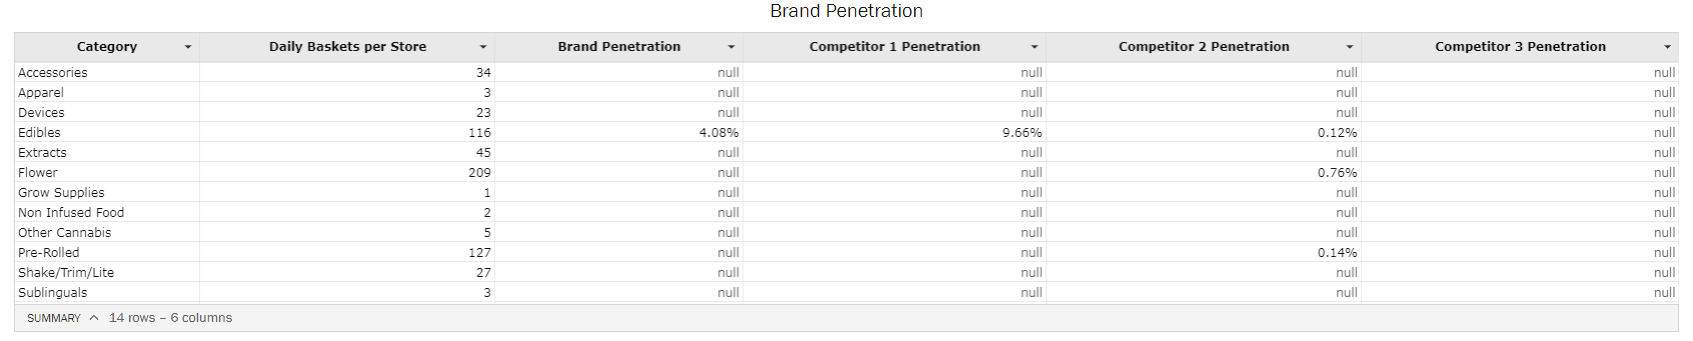
Brand Penetration tracks the total % of transactions for that category that the selected brand can be found in.
- Ex: there are an average of 116 edibles baskets per day per store, and the selected brand can be found in, on average, 4% of those baskets
- Overlay this information with total purchase frequency, basket size, and items per basket to understand what brands are popular, drive consumers to purchase more, and/or drive larger total transactions.